

Rating the Reviewer
Does my FINS star rating system correlate to future stock performance?

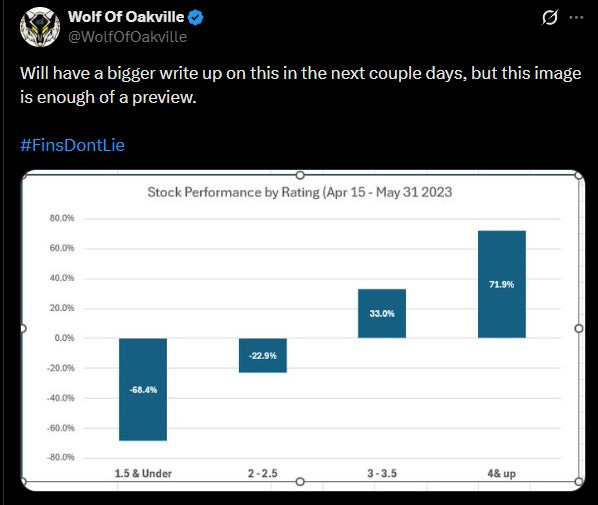
Last week I received a reply from Yellowbrick Investing to one of my tweets:
“Do you happen to have any data on the performance of your write-ups by star rating? Or even just above/below a certain star rating”

The answer was yes, but it made me realize it was something that I haven’t done in sometime. In fact, I haven’t pulled any data on my reviews to see if there is a correlation between rating and future stock performance since I made the move to Substack. Today that changes.
Paid Subscriber Benefits:
First access to annual picks, upgrades and mid year “Seal of Approval” picks.
Monthly “What’s Wolf Watching” preview of upcoming earnings and potential market moves.
FinsDontLie Scholastic Series - exclusive educational posts
Access to The Wolf Den Discord community (daily insights, charts, chat & Q&A)
Before we get to that, I’d like to give a shoutout to Yellowbrick Investing. They have been a great promoter of mine and so many other writers on Substack and other platforms. Thanks for the push to have me go through this exercise, as it’s been too long. Check them out.
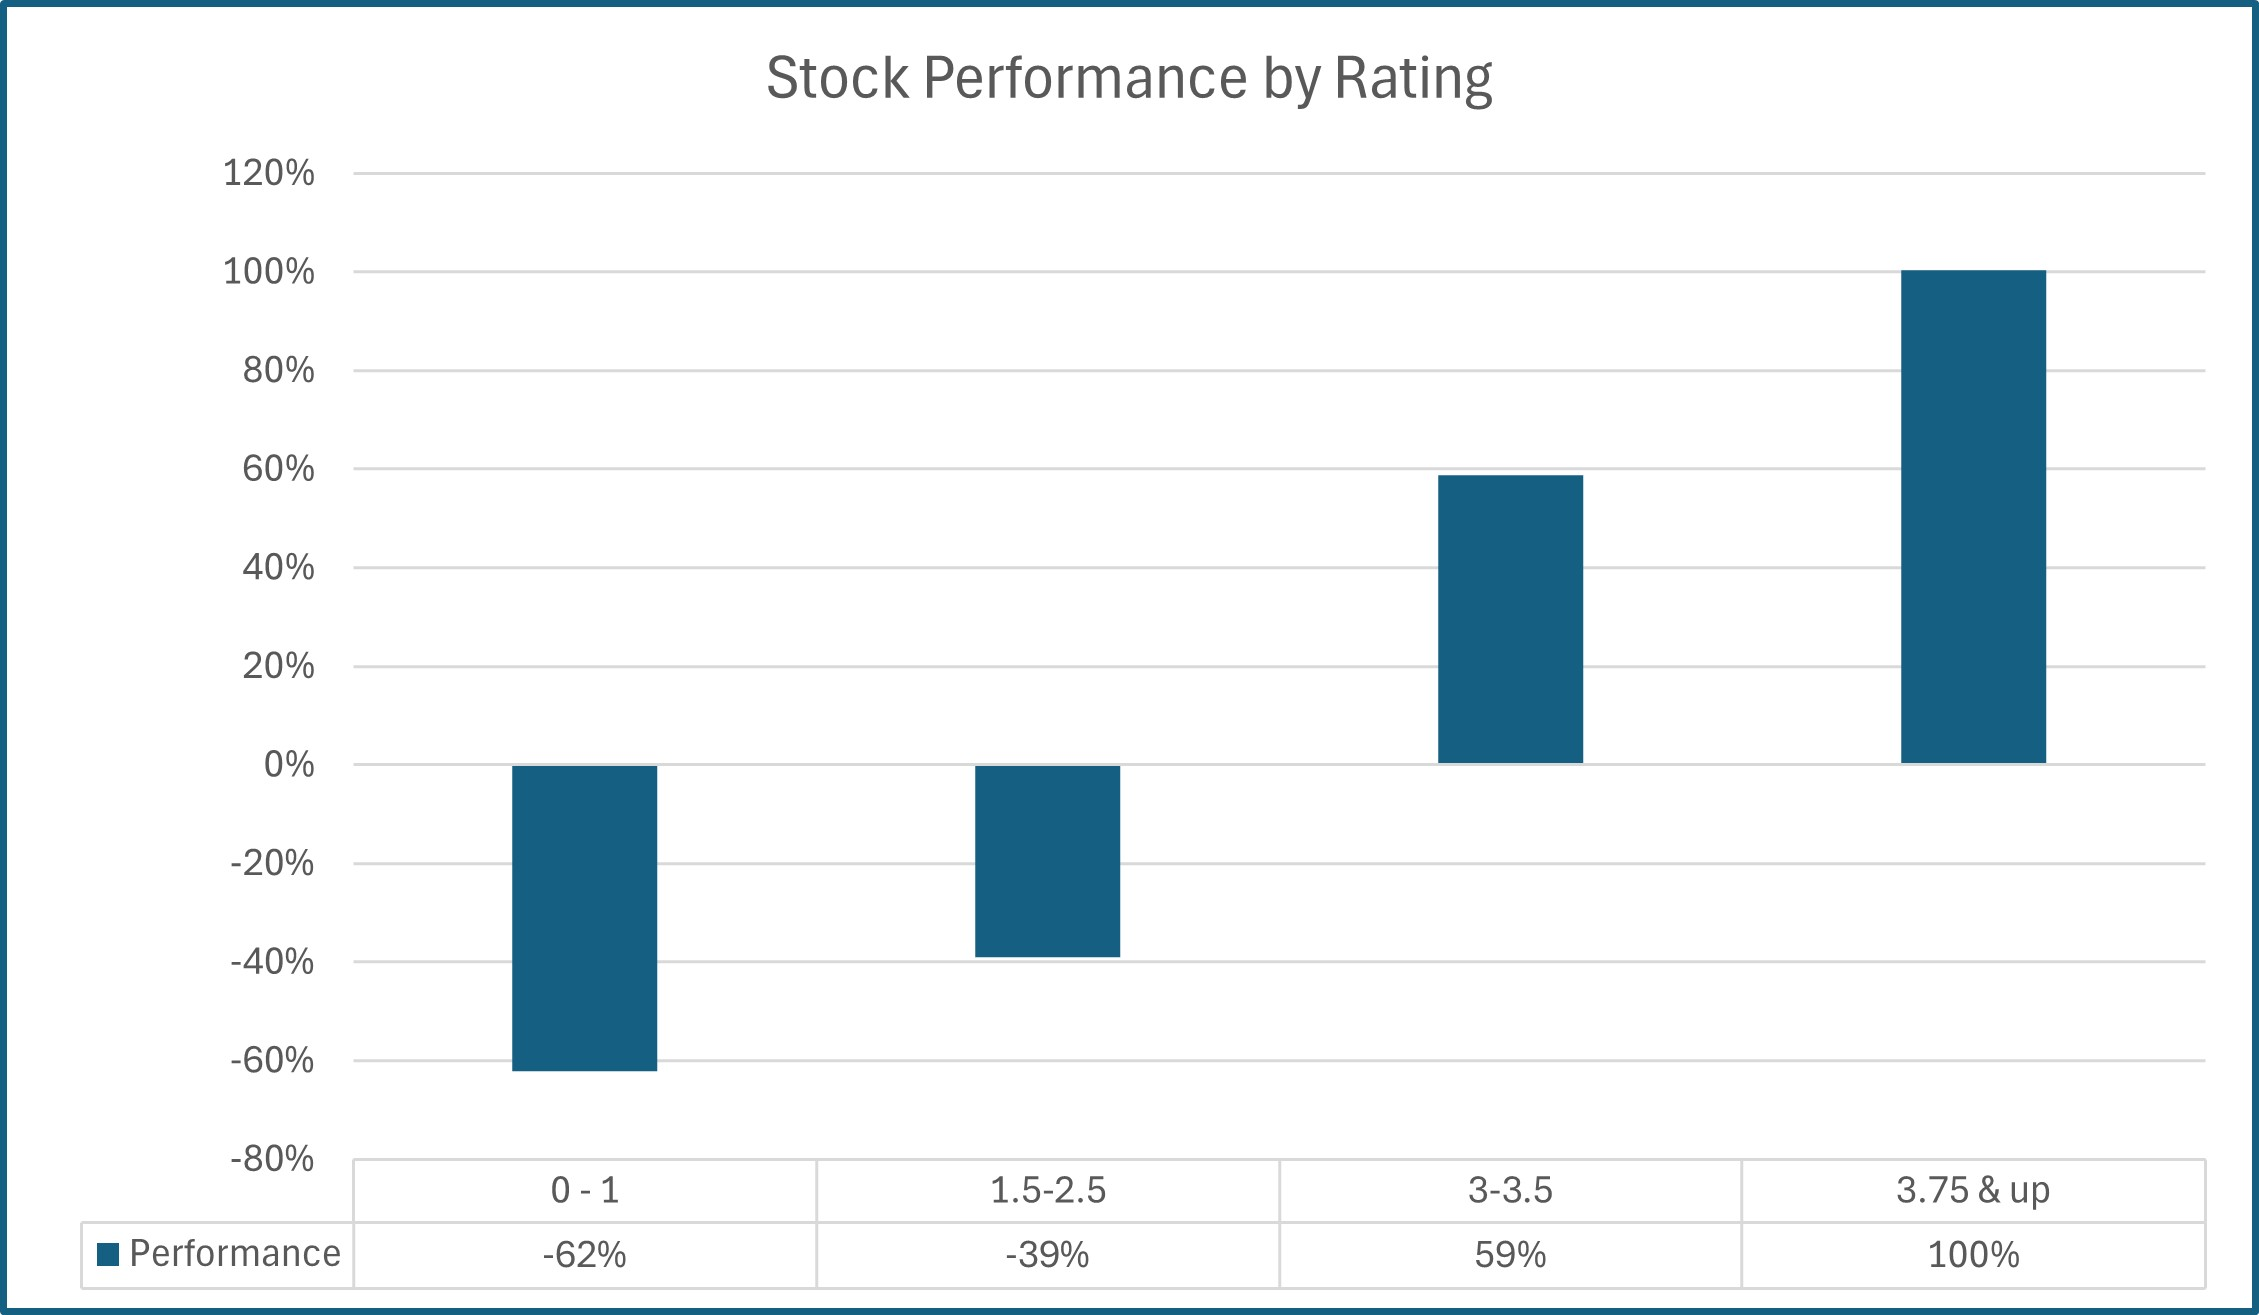
Here is what the data looked liked the last time I went through this process in April of 2024:
How was the data selected and compiled?:
To generate a large enough sample size, I like to take approximately 50 reviews that are near one year old. For this exercise I selected reviews between November 2024 and February of 2025 to generate that sample. Forty-five different companies were reviewed during this period. Many stocks were reviewed twice and in those instances I used the oldest.
For stock price performance, I took the last closing price prior to when their financials were released and compared them to today’s price I then grouped them into categories from my star ratings (0-5).
Clear as mud?
The Data:
Overall, I would make the determination that the results are quite similar as the last time I went through this exercise, with more dramatic positive results the higher the star rating.
Let’s review the individual data by category and look
for anomalies.
1 star reviews and under:
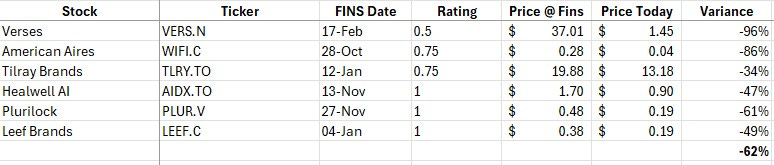
Not many anomalies here with six stocks receiving a review of 1 star or less, averaging a 62% decline since. The worst rating, Verses was also down the most, a staggering 96%.
1.5 - 2.5 stars:
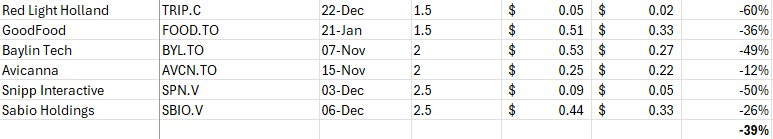
Six reviews fell into this category, all in the red since their reviewed financials, ranging from -12% to -60%.
3.0 - 3.5 stars:
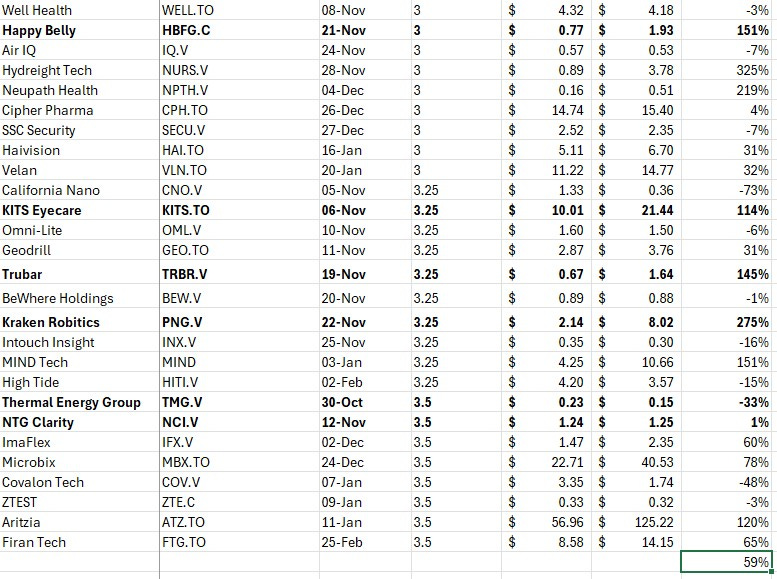
One of the most interesting things about this category is that 60% of all reviews fell within it, averaging a 59% increase over that time. The range however is substantial with California Nanotechnologies decreasing by 73% all the way to Hydreight Technologies increasing by 325%. \
Ratings of 3.0 also outperformed 3.25 and 3.50 reviews with several multi-baggers.
I like to refer to stocks in this category as “Tweeners”, as ones that are in between having great financials statements and terrible ones. Another factor I like to point out often to my readers is while two stocks may receive the same rating, that does not mean they are equally investable. Personally, I think this is where good retail stock pickers are separated from the rest, and it comes down to intangibles and due diligence.
Of the 27 stocks listed above, six are in bold and those are 2023 or 2024 Wolf Picks. Those average a 109% on those reviews. Thermal Energy Group, the only one in the red, I exited three months earlier when my thesis changed. Neupath Health, up 219% was also a bonus pick from my 2025 Wolf Pick article.
3.75 & up:
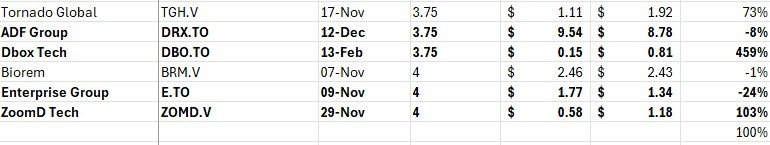
It shouldn’t come as a surprise that two thirds of this category were or became Wolf Picks. Again the worst performer, Enterprise Group was an exit, but I still hold the other three. Biorem was downgraded twice in subsequent reviews.
Summary:
I think there is enough correlation here to suggest my ratings are meaningful, particularly when the ratings are poor. A shitco will always be a shitco, but there are still a number of retail investors who lose a lot of money in them. In the five years I’ve been reviewing financials this way, the only stock I can think of that succeeded was Reitman’s Canada, and that was only after entering into bankruptcy proceedings and coming out the other side a much improved retailer.
While meaningful, the ratings are not absolute, particularly as you get into what I would refer to as the “investable range” with 3 stars or greater. A small or microcap stock will never be one that you can “set and forget”. They must be continuously reviewed to ensure the thesis remains intact. One of the best examples of that from this list is probably Enterprise Group.
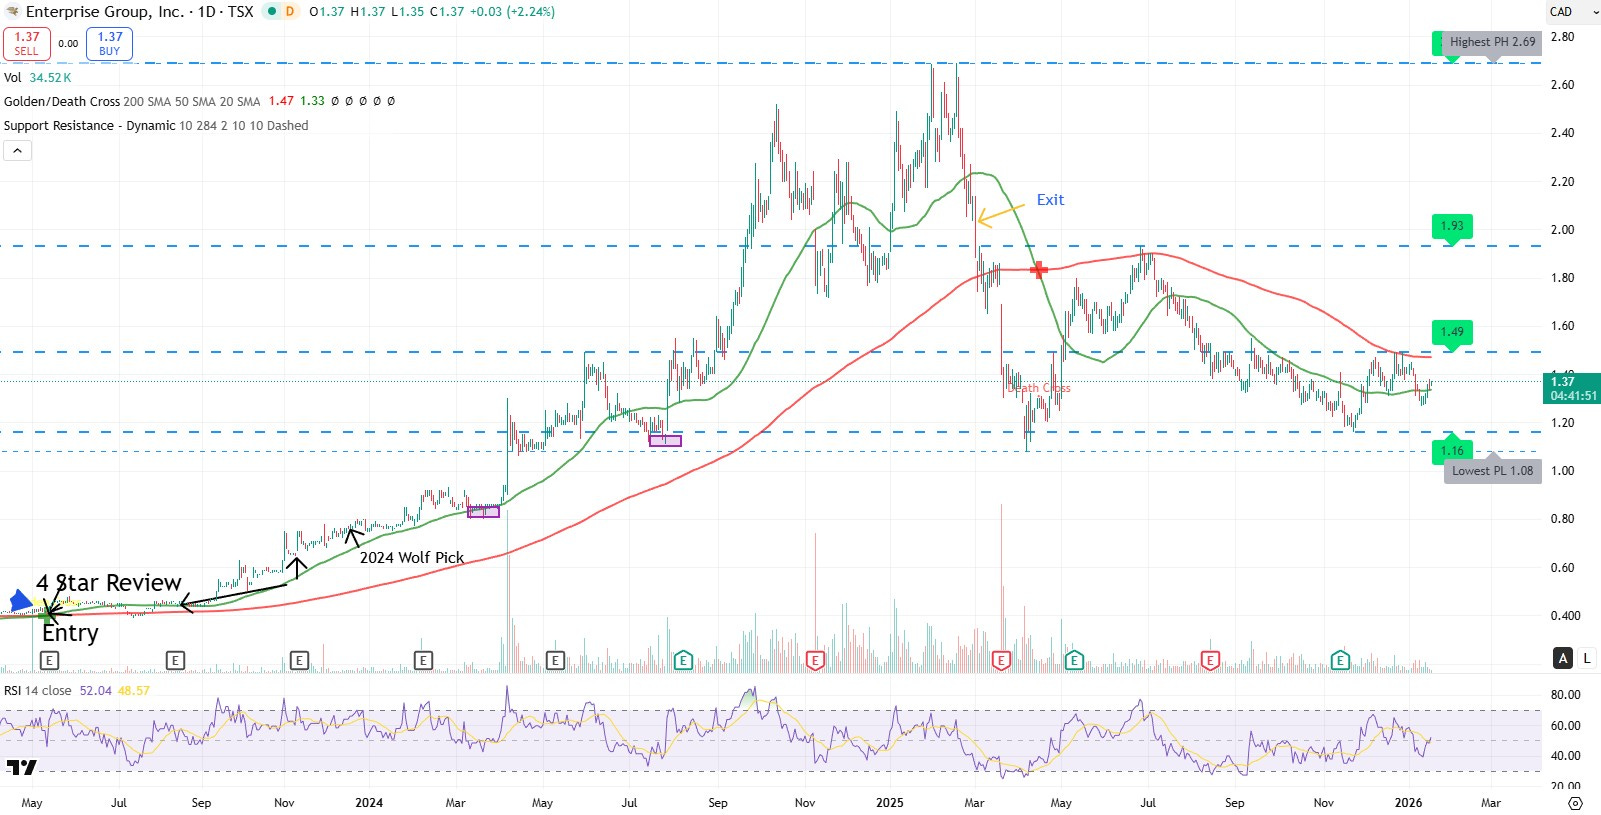
I first bought Enterprise in May of 2023 in the forty cent range with a 4 star review. They later became a 2024 Wolf Pick and received a rating as high as 4.5 stars. The thesis changed when I lost faith in management early in 2025 and I exited my position. The stock has continued to tumble since. In hindsight, I should have recognized it earlier.
Thanks to Yellowbrick Investing once again, I’ll try to do this exercise more often in the future.
I can’t rate myself, so how would you rate the reviewer? Leave a comment with how you think I did (I’ll probably regret this).
Disclaimer:
My intent is for my reviews to be a bolt on to due diligence that you have already completed. I receive dozens of review requests a week, therefore my own DD may be great or none whatsoever. Unless otherwise stated or implied, my opinions are on the financial performance of the company based on their most recent filings. I conduct these reviews to assist other retail investors whose research skills are limited when it comes to reviewing financial statements. I do not accept compensation of any kind from companies I review.
Wolf FINS Reviews are intended to be informational and are based on personal opinion. They are not intended to be financial advice, and all readers are encouraged to perform their own due diligence prior to their investment decisions, including discussions with their investment advisor.
4.75/5
Great to see that your scores seem to correlate with performance :)
One kind suggestion: could you provide more robust statistics than the simple average, such as the median, i.e. the 50th percentile? The simple average can easily be skewed by outliers while the median is a more skill-revealing imo and straightforward measure.
Cheers